
How to Draw Images in Charts Labels in React-ChartJS-2?


A short time ago, we were working on an exciting task. Using the react-chartjs-2 library, we had to render an image with dynamic text instead of the regular label.
We spent a few days looking for a solution because the library has no standard options for using images in charts labels. But fortunately, ChartJS provides various methods that can be used to write custom logic, and we did just that!
Challenge: Draw images in charts labels using react-chartjs-2
Here is a simplified design of what we need to achieve:
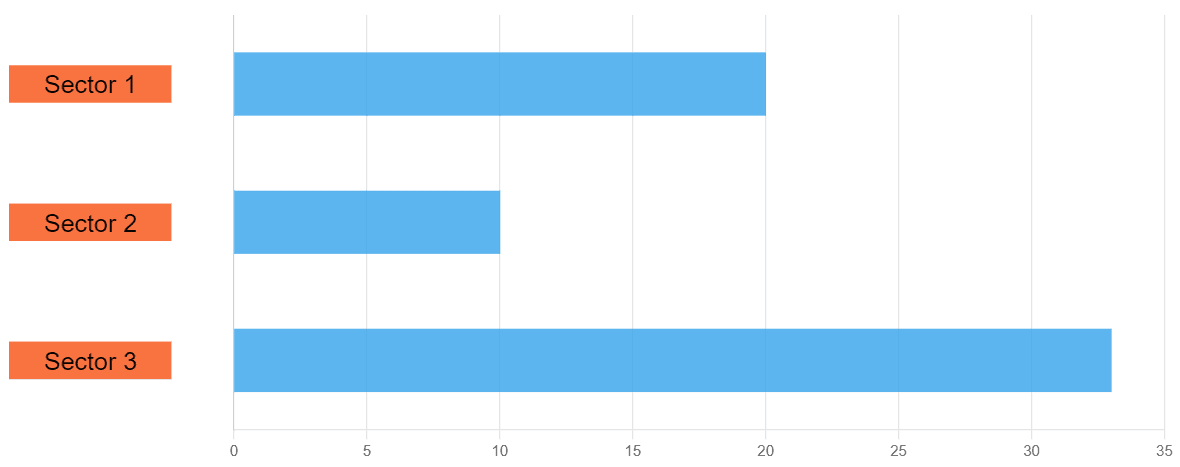
This is a basic horizontal Bar chart from the ChartJS library and custom orange labels with dynamic text on top.
Solution
Let's create a data array and chart component.
const data = [ { sector: 'Sector 1', count: 20, }, { sector: 'Sector 2', count: 28, }, { sector: 'Sector 3', count: 42, },];
const options = { indexAxis: 'y', responsive: true, maintainAspectRatio: false, plugins: { legend: { display: false, }, }, scales: { y: { ticks: { display: false, }, grid: { display: false, }, afterFit: (scaleInstance) => { scaleInstance.width = 150; }, }, },};
const chartData = { labels: data?.map((item) => item.sector), datasets: [ { data: data?.map((item) => item.count), backgroundColor: 'rgba(53, 162, 235, 0.8)', barThickness: barSize, }, ],};
const BarChart = () => ( <Bar data={chartData} height={360} options={options} redraw={true} />);To change the default behaviour of the chart and apply a custom function, we need to use the plugins prop and create a plugin with a unique ID and set of methods.
Two methods are needed to solve our challenge - beforeDraw and resize. The beforeDraw method allows us to render the images before drawing the chart. The resize method called after the chart is being resized.
<Bar … plugins={[ { id: 'pluginId', beforeDraw: (chart) => handleDrawImage(chart), resize: (chart) => handleDrawImage(chart), }, ]}/>Both methods call the handleDrawImage function. But before writing it, we need to load the label image to draw it into the function.
const [isImageLoaded, setIsImageLoaded] = useState(false);
const labelImage = useMemo(() => { const image = new Image(); image.src = "../image.png";
image.onload = () => { setIsImageLoaded(true); };
return image;}, []);In the code above, we define the isImageLoaded state to see whether the image is available. Then, we create the labelImage method to load the image and wrap it into the useMemo hook to keep the same result between re-renders.
Now, we can start implementing the handleDrawImage function.
First, let`s define the constants needed for the calculation.
// Chart bar heightconst barSize = 50;
// Chart image height and widthconst imageHeight = 30;const imageWidth = 130;const imageHalfHeight = imageHeight / 2;
// Top spacing of the image from the beginning of the bar// It is required to move the image to the middle of the barconst imageBarOffset = (barSize - imageHeight) / 2;
// Text height and font stylesconst textHeight = 15;const textHalfHeight = textHeight / 2;const textFont = "normal 20px Arial, sans-serif";Then, get the canvas object from the chart, the chart height, and the data length.
const { ctx } = chart;const chartHeight = chart.chartArea?.height;const dataLength = chartData.length;Calculate the step for our labels and display them on the chart using these values.
const step = (chartHeight - barSize * dataLength) / dataLength;
// Canvas method that saves the current statectx.save();
chartData.forEach((element, i) => { // Calculation of the image Y-coordinate const imageY = i * (barSize + step); // Canvas method to draw the image (image src, x, y, width, height) ctx.drawImage(labelImage, 0, imageY, imageWidth, imageHeight);
// Canvas method that restores the recent saved canvas state ctx.restore(); });We get the following:
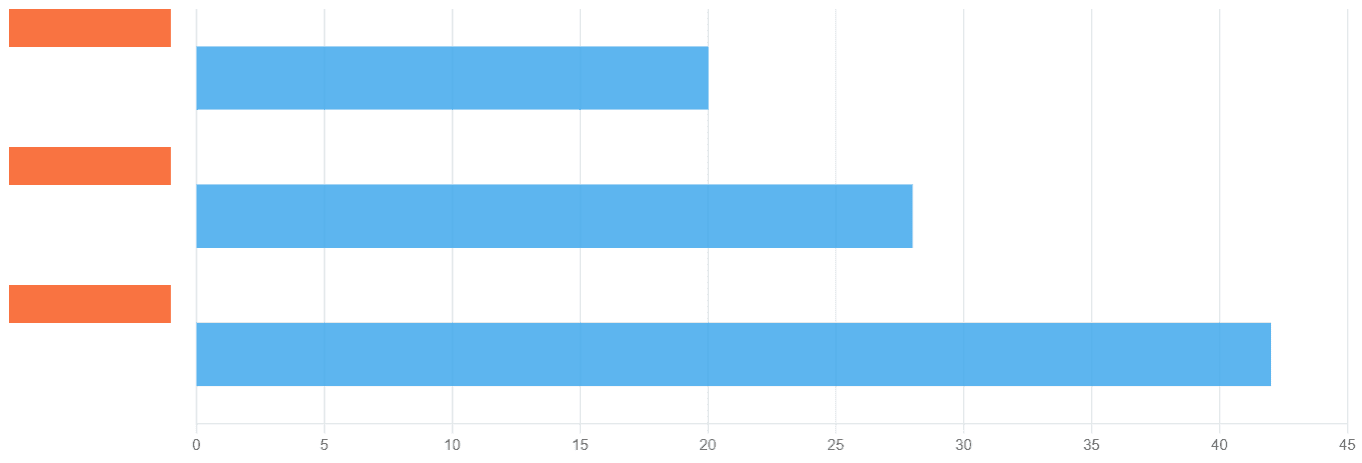
On the screen above, we can see that our labels display with the correct step, but according to the challenge, we have to move them to the middle of each bar chart. To do that, we need to calculate an additional y-axis indent for each label we have.
const step = (chartHeight - barSize * dataLength) / dataLength;
// Calculation of the additional Y-axis indent+ const stepOffset = step / 2 + imageBarOffset;
ctx.save();
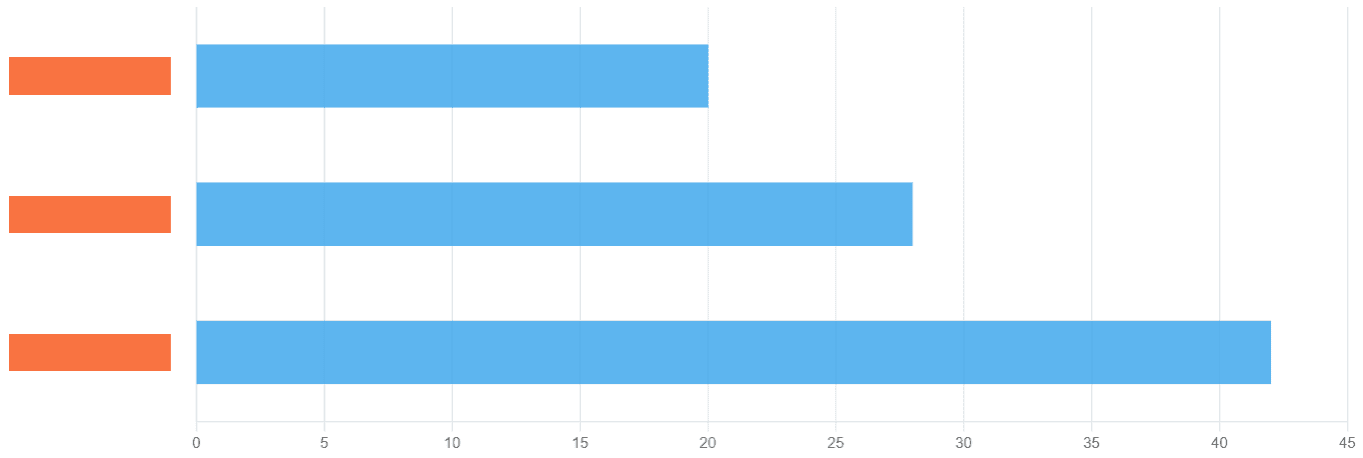
chartData.forEach((element, i) => { const imageY = i * (barSize + step) + stepOffset ; ctx.drawImage(labelImage, 0, imageY, imageWidth, imageHeight); ctx.restore(); });As a result, we get the following:
Now all we have to do is add text over each image.
const step = (chartHeight - barSize * dataLength) / dataLength;const stepOffset = step / 2 + imageBarOffset;
// Apply styles for text+ ctx.font = textFont;
ctx.save();
chartData.forEach((element, i) => { const imageY = i * (barSize + step) + stepOffset ;
// Find the text width and calculate text X and Y coordinates+ const textWidth = Math.floor(ctx.measureText(element.sector.toString())?.width);+ const text = { x: (settings.imageWidth - textWidth) / 2, y: imageY + settings.imageHalfHeight + settings.textHalfHeight };
ctx.drawImage(labelImage, 0, imageY, imageWidth, imageHeight);
// Canvas method to draw the text (text, x, y)+ ctx.fillText(element.sector, textX, textY);
ctx.restore(); });We use the forEach loop to calculate each label's image and text coordinates. We get the width of the text to put it in the middle of the image. And finally, we draw our elements using the canvas drawImage and fillText methods.
Et voila! Our job is done.
The life code example you can find here.
We hope this article was helpful to you! Thanks for reading!
